
Insights from Annual Fund Analysis Will Improve Your Fundraising Results

Why have us analyze your annual fund results?
Yes, your donor management software can export many reports for you, and you don’t need us to know what your overall results are and whether or not you made budget.
But there are advantages of having Five Maples perform an annual fund analysis for you once each year*.
We bring experience in analyzing performance you might not have internally or on your board. (Check out the bio of our President, Gary). We are not just data nerds—although we are that!— we are business and development leaders who over our careers have had to constantly diagnose business problems, implement changes and live with the results.
We present and get feedback: both to individual organizations and at industry events. Our analysis process has been refined over the past 10 years to be as useful as possible.
Each year we analyze annual fund performance from organizations in all sectors of the industry. That gives us knowledge about benchmarks you probably don’t have and the ability to make recommendations on what we see working for others.
We work closely with you throughout the year, giving us inside knowledge that helps us make and carry out recommendations for improvement that we both agree to.
You get a slide deck from which you can cherry pick graphs and tables that you can use with your management and board to show what you have accomplished and how you are going to improve.
What is the Five Maples Annual Fund Analysis Process?
Our Annual Fund Analysis starts with the total, annual results for your program, then focuses on individual giving without events or public foundation grants.
Annual Fund Analysis digs into your data, asking questions like:
How do you compare to industry benchmarks?
Are your solicitation and stewardship efforts boosting donor engagement and loyalty?
Are you growing at all levels, both with small donors and major donors?
Are your acquisition, retention, and recovery rates sufficient to grow your program?
Are you benefiting from multiple gifts per donor per year?
Which constituencies are the most responsive? What are your best sources of new gifts?
How are donors responding to and moving between giving channels?
Our process has these steps:
We discuss with you the timing and goals for annual fund analysis, which types of giving or constituents will be included in the data, and how to handle issues like pledges, soft credits, or Donor Advised Fund giving.
You export a list of all gifts to us, usually going back to 2008.
We run preliminary numbers and check in with you to verify we are on the right path.
We present the final analysis and recommendations via Zoom, update with any questions or tasks that came out of the presentation, and provide you with the slide deck and with any data export that will be helpful, like RFM scoring.
Following are typical graphs, charts, and observations from Five Maples Annual Fund Analysis.

Measure Program Performance Trends
Your Ten-Year Trend
This gives the top-level view...the numbers you might be most familiar with.
It’s a starting point. The most useful insights will come from digging into the details of these data sets to find out why the numbers are trending the way they are.

Benchmark Your Program
Are you under-performing or out-performing your fundraising peers?
Benchmarking is a powerful tool that can help you know what you are doing successfully and where you are falling short.
There are some good industry benchmarks published regularly. We save you the time and effort to find them by bringing them together for you.
The Association of Fundraising Professionals Fundraising Effectiveness Project (AFP-FEP) compiles anonymized collected data from over 10,000 non-profits provided by multiple participating donor-software companies.
The Blackbaud Institute’s annual Charitable Giving Report compiles results from over 8,800 non-profit clients.
The Giving USA annual report covering all giving in the USA is researched and written by the Indiana University Lilly Family School of Philanthropy using multiple industry sources and economic modelling.
Benchmark Your Total Giving
Benchmarks by Sector from Difference Sources
Benchmark Your Donor Retention and Growth in Giving
AFP reported growth both in giving and in number of donors in 2020. This organization’s retention and growth in giving for 2020 out-performed the AFP benchmarks—except in growth rate of donors. But a further look into the numbers will probably show that the number of new donors was barely enough to stay even in donors. We would also encourage the organization to improve their new donor retention… shooting for 30-35%.
Benchmark Your Annual Fund Performance Against Your Sector and by Size
Drilling into the Details with Five Maples Benchmarks
Published benchmarks are always at a high level. So, we add our own benchmarks by aggregating anonymized results from our clients to drill down on specific metrics, as you’ll see on other charts and tables on this page.
For example, here we compare the loyalty of your donors to the average of Five Maples customers by calculating the % of your donors by the number of years they have given.
Here we compare the number of gifts and $ per year to the median of Five Maples customers to see if you are successfully receiving multiple gifts per year from your donors.

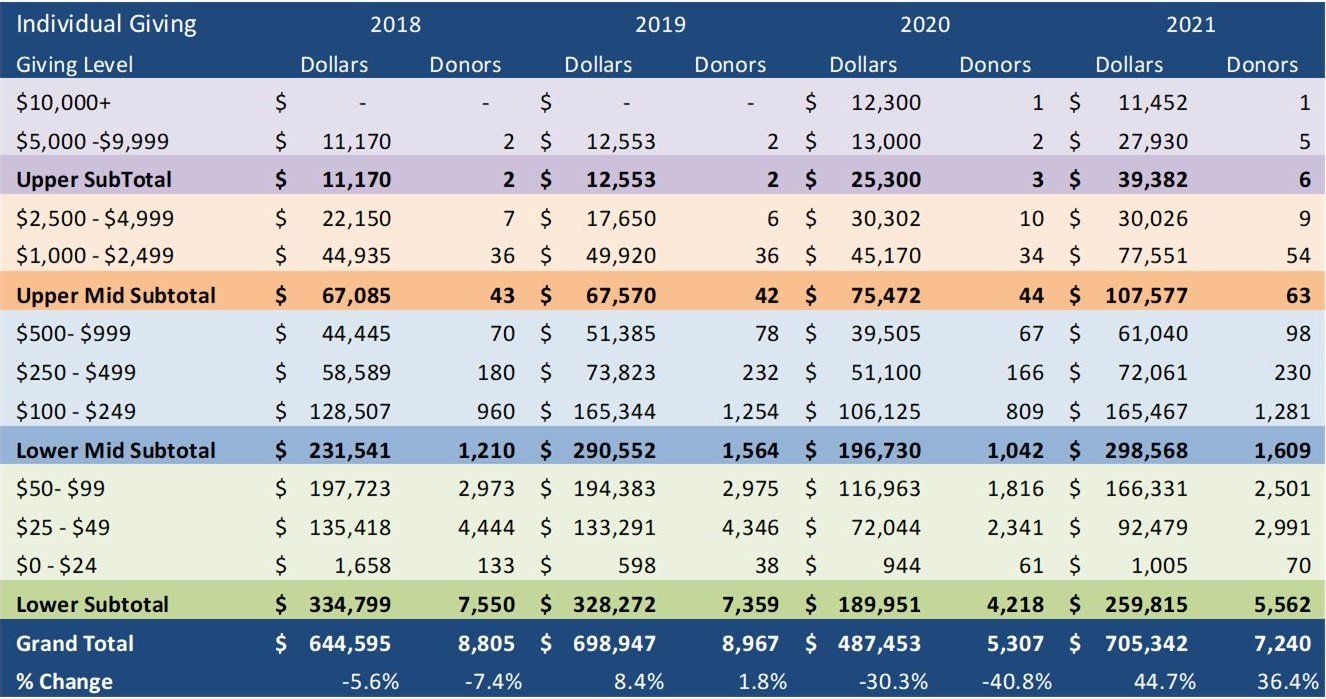
Evaluate Giving Progress by Size of Gift
Are you successfully growing donations at the bottom, middle and top of the pyramid of giving?
For example, growth only at the top can spell trouble for the future, since smaller but faithful donors are a source of future major givers or bequests. This example, for Individual Giving with major donors excluded, shows strong recovery in all ranges of giving from the early stages of the pandemic. However, the number of small donors was higher pre-pandemic. Further analysis is needed to identify whether that is due to a decline in new donors, or in donor retention, and what program changes are required to recover those levels.

Dig Into New Donor Acquisition and Retention
A healthy fundraising program will bring in more new donors than are lost through attrition each year.
In this example, new donors as a % of total donors is under 30%. Usually at least 35% new donors are required to compensate for attrition – since retention of multi-year donors usually doesn’t exceed 65%.
Here the dollars from new donors in 2021 was quite high, likely reflecting an unusual gift or two. That could distract from the serious decline in new donors in 2021. Brainstorming and planning for sources of new donors is required.
The most troublesome metric in fundraising may be retention of new donors.
In this example we see the organization exceeding an industry benchmark--AFP’s published new donor retention average across the industry. In the profession the low retention of new donors has often been deplored. This organization is doing better than average. That’s good, but not good enough. In our experience the best performing programs achieve 35% retention of new donors. How? By devoting resources to stewardship of new donors…thank you letters, personalized notes, thank you phone calls, donor impact reports and emails, special invitations to engage, and multiple follow up solicitations.


Dig Into Retention and Recovery of Lapsed Donors
Once a first-time donor has given again, their chance of continuing to give doubles—or should if the organization is doing a good job delivering the mission and constantly showing their donors how much good their gifts are accomplishing. This organization has great stewardship and asks multiple times per year, resulting in above average multi-year renewal rates; but the slight decline in renewal rates year by year needs addressing. The average age of donors in the US is 62. A gradual decline in renewal rates for an organization doing a good job at stewardship might be due to an aging donor pool. Looking at the percent of new donors might show that not enough are being acquired to maintain the donor pool.
Five Maples clients typically have much higher donor recovery rates than the national average. Why? We encourage constant donor impact stories and reporting. Too many nonprofit organizations fail to use email, direct mail and social media regularly to tell their donors how much they love them and how their money is getting things done. They aren’t constantly sharing stories with their donors. Donors should be treated to impact reporting at least once per month, and once per week would be even better. Yes, staff time is short. You may need to get help from your fundraising agency.
But don’t worry about annoying your donors; email open rates by donors are much higher than national averages for other groups and unsubscribes are low. Donors want to hear from you. Penelope Burke’s research shows that one reason donors stop giving is a “failure by non-profits to communicate”.
Also, you will raise more than it costs to stay in-touch with and to solicit donors by email and direct mail who are lapsed up to 6 years. Don’t give up on lapsed donors!

Life-Time Value
How much the new donors you added in the past are worth now is determined especially by retention rates and this typical table shows their staggering effect. Only 16% of the 132 new donors gained in 2016 were still giving in 2021. Most of them were lost after their first year of giving, which makes renewing first-time donors possibly the most important goal for your development program.
Once you’ve converted first-time donors into multi-year donors their value not only persists but can continue to rise as the attention you give them through development communications and personal relationships increases the amount they give.

Drill Down into Segment Performance
Drilling down into the results by donor segment helps you allocate staff time and budget. In this example, driven by conditions during the pandemic, a drastic reduction in the time spent on events switched to reaching out to major donors and focusing on individual giving, helping the overall results grow. That doesn’t mean events aren’t coming back, but it was a helpful lesson in how to allocate time.
In this example a special Fund was activated to support Musicians. The increase in new donors, growing dollars from current donors, and strong renewal percentages for this special Fund shows that the messaging and efforts to build the fund are paying off and should continue to get resources.

Benchmark Your Donor Loyalty
We aggregate donor loyalty data to produce averages and medians. This donor data allows us to compare this organization’s donor loyalty against our benchmark (the FM Median of number of years of giving in the last 10 years). This organization may appear to be below average in acquiring new donors since the percentage of donors giving for one year is lower than the median, but it is because they exceed the benchmark for donors who gave 4 to 10 years of the last 10 years. They keep donors at a higher rate than the median. That bodes well for long-term financial health as well as for future planned giving growth.
Number of Years of Giving
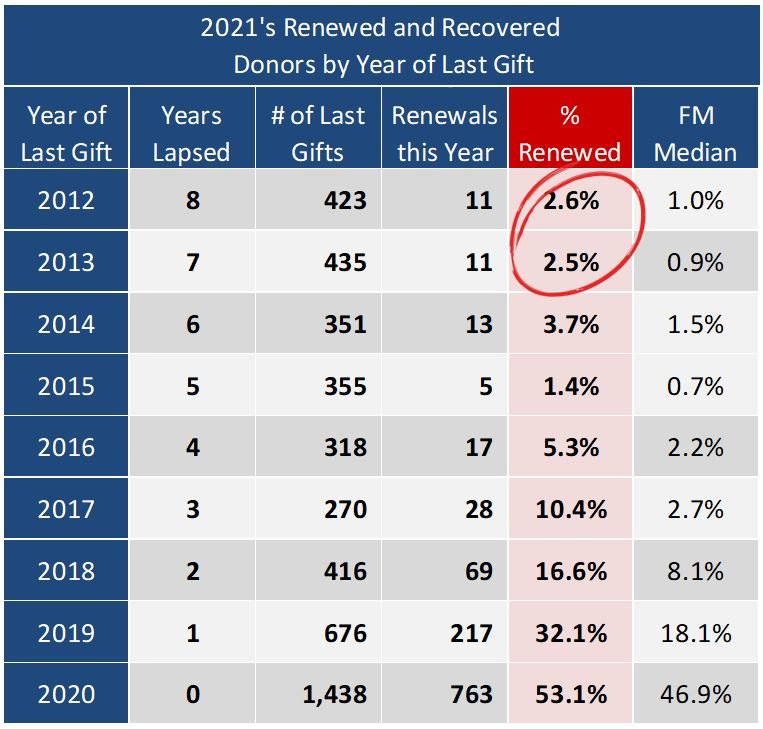
Recovery by Year of Last Gift
Donors do leave; but often not because they lost faith in the organization’s mission; their financial situation or other priorities can get in the way. Or perhaps the organization stopped soliciting them after the didn’t get a gift for several years. Knowing how far back to solicit lapsed donors is important. Usually the cost to recover a lapsed donor exceeds the potential when the recovery rate drops below 1%, and that’s normally when the last gift was five or six years ago. This organization is having success in recovering donors more lapsed than that and should continue soliciting deeply lapsed donors until the recovery rates drop.

Multi-Asking Means Multi-Givers
Are you asking enough? In this example, No. Multiple gifts per year are too few.
Here we compare the number of gifts and $ per year to the median of Five Maples customers to see if you are successfully receiving multiple gifts per year from your donors. This organization clearly isn’t asking enough times during the year compared to their peers.
Are you asking enough? In this example, Yes. And the giving trend is improving.
Increasing donor impact communications and the number of solicitations will increase the number of gifts per donor per year, as this trend shows for an organization that did so in 2021.
Are you asking enough? In this example, Yes. Multiple gifts per year are boosting performance.
Fundraisers are often surprised at how much money comes from donors who give two or more times during the year. For following table monthly givers have been excluded in order to focus on how many donors respond to a solicitation more than once per year. This organization runs five direct mail + email campaigns per year, plus two direct mail impact reports with reply envelopes and multiple donor impact emails. They know that donors will give more when given multiple opportunities to give during the year. The large amount of money raised from those giving more than once shows the effectiveness of multiple asks. "Donor fatigue’ is a canard. Organizations that worry they ask too often are actually not giving donors enough opportunities to show they care.

Use RFM Analysis to Find Prospects for Upgrades and Planned Giving
RFM stands for “Recency”, “Frequency”, and “Monetary Value”. Used in consumer marketing to provide predictive analytics on who will buy more, it’s helpful for identifying donors who have more giving potential.
RMF RFM Analysis provides a score for each donor based on how recently they donated, how many of the last 10 years they have donated, and how much they donate (both cumulatively and largest gift).
A donor who gets the maximum score for each of Recency, Frequency and Monetary would get the maximum total score of 100.
Max Recency Score = 25
Max Frequency Score = 35
Max Monetary Score = 40
Donors with scores >= 80 are usually known to development staff. But donors with scores between 60 and 80 may warrant closer attention than they are currently getting.
For example, a donor giving $100 every year of the last 10 years will score 65. Such donors are prospects for wealth screening, for upgrade to a major gift portfolio, monthly giving, multiple gifts, or planned giving communications. They may warrant a special thank you, invitations to events by staff, or recognition in appeal verbiage.
There are many scoring systems reported in the literature. Our method is adapted from Birkholz, J. (2008). Fundraising Analytics: Using Data to Guide Strategy, The AFP/Wiley Fund Development Series.
When we run RFM scoring on your donor file we will export back to you a list of all your donors with their recency, frequency and monetary value and total scores.

When do your Donors Give? Giving by Month
It’s a truism that donors are most generous around the end of year holidays, and this graph of monthly giving for an organization, plus the median and upper 75th percentile and lower 25th percentile of the customers we analyze reinforces that. This organization also runs a community-based event in the spring, with associated direct mail and social media fundraising that helps balance out the year.

Where are your Donors?
Donor demographics provided by Geo Heat Maps help prompt discussion of where there might be a higher (or lower) concentration of donors or dollars than you realized, and where perhaps some acquisition focus, networking events or influencer recruitment might pay off.
Number of Donors
Giving Amount

Determine Your Best Sources of New Gifts
Moves Analysis: First Gift segment or channel
* By the way, we don’t do analysis for non-clients; we consider it an integral part of our client working relationships and we reserve our resources for organizations we work with year-round. For those who aren’t clients we share our expertise via public speaking and via this web site.
Want to learn more about our Data Analytics for nonprofits?
Contact us today at garyh@fivemaples.com for a free consultation.